
Set assumptions for your company’s key parameters and model a long-term forecast of the income statement, balance sheet and free cash flow.
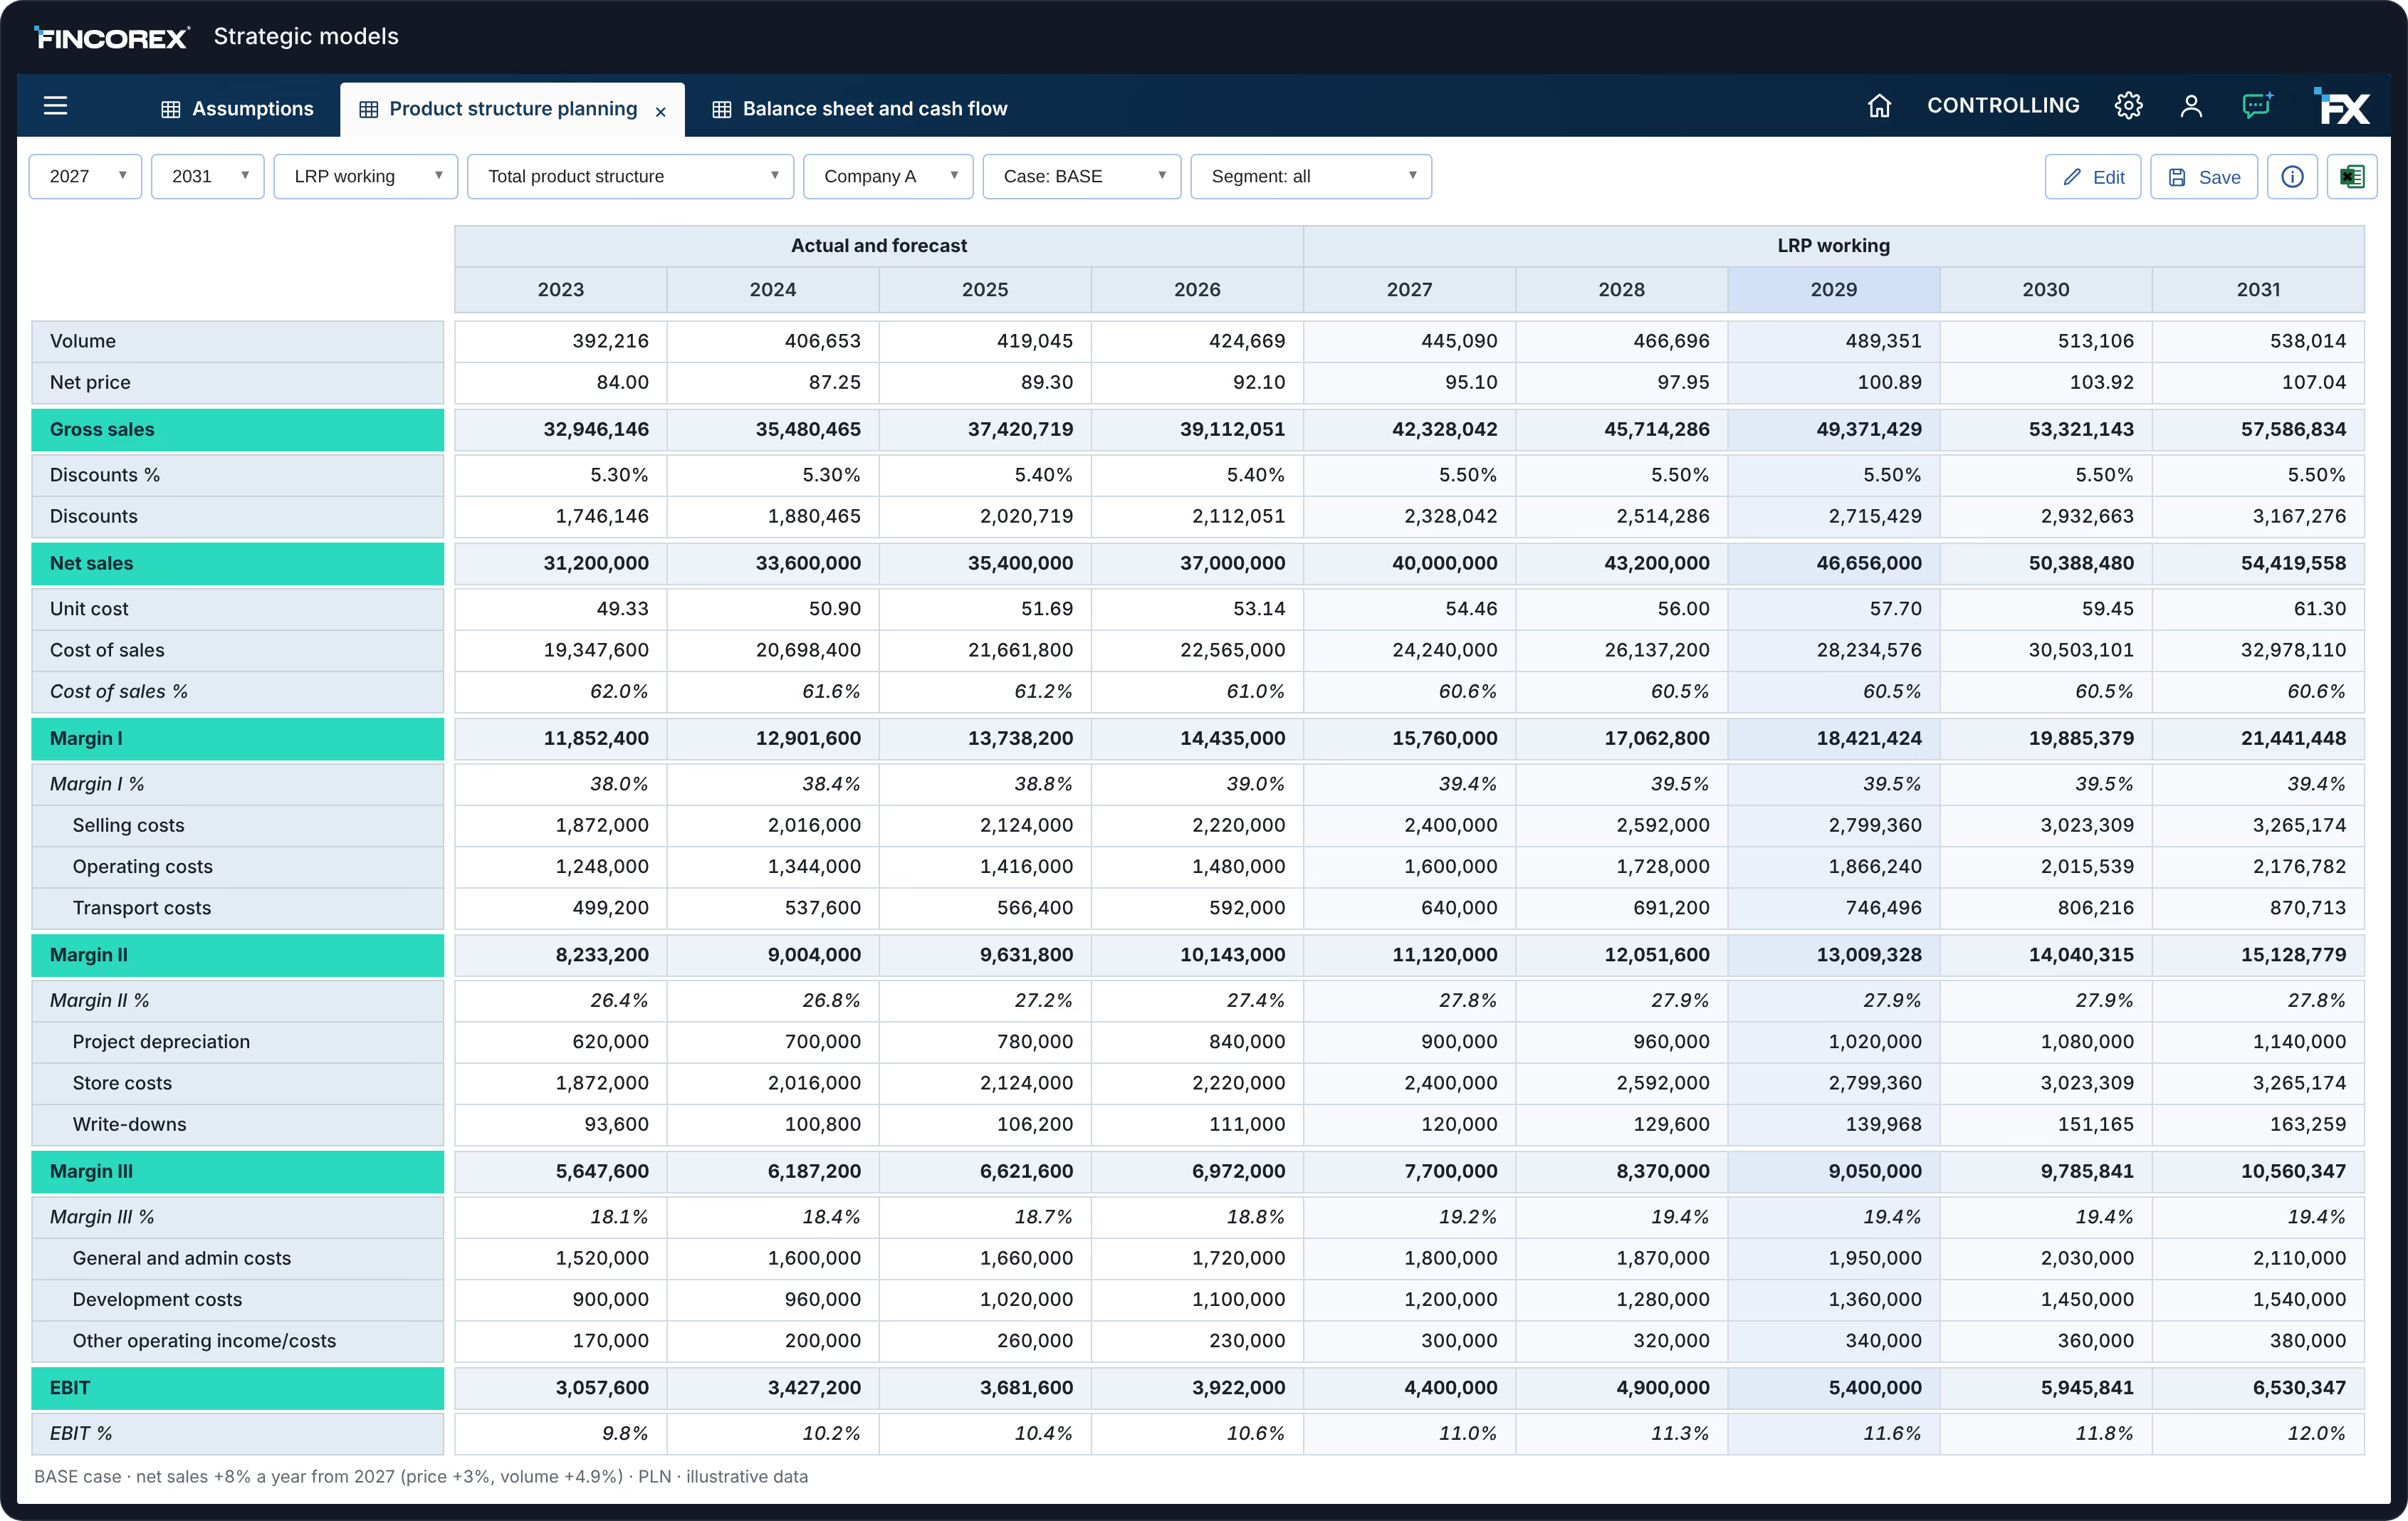
Growth, margins, turnover and capex as model parameters.
Turnover ratios drive working capital.
Revenue, costs and result over a multi-year horizon.
Assets, liabilities and working capital in every year.
Cash from results, investments and changes in working capital.
Fast planning using growth rates or other techniques.
Planning from a template or individually.
Conservative, base and growth cases in one model.
Assumptions and results of each case side by side.
With revenue of PLN 40m, cutting receivables turnover from 60 to 45 days releases about PLN 1.6m in cash and raises free cash flow by the same amount in the year of change.
PLN · illustrative data
Assumptions flow into all three statements at once. In this example, 8% annual revenue growth lifts EBIT, while better inventory turnover limits the growth in working capital.
Sample forecast for 2027–2029 · PLN thousands · illustrative data.
Match the planning technique to the product’s maturity.
Plan sales using growth rates, historical trends or other techniques – quickly, for the whole portfolio.
Use a market launch template or plan the product individually: volume, price and costs.
Receivables, payables and inventory turnover translate the sales plan into the balance sheet and free cash flow.
Show the board and owners the P&L, balance sheet and cash flow of each case, along with the assumptions behind them. The controller changes assumptions and sees the effect immediately.
Data access according to assigned permissions.
Dashboards and reports built on model data.
Historical and financial data from accounting, ERP and Excel.
Update assumptions and input forms within your permissions.
Sample report layout · illustrative data
Any multi-year horizon, e.g. 3, 5 or 10 years – set it to match the goals and decisions you want to support.
Yes. Assumptions flow into the income statement, balance sheet and free cash flow in every forecast year.
Receivables, payables and inventory turnover set the level of working capital, and its change drives cash flow. Change a ratio and see the effect on the balance sheet and cash immediately.
From a ready-made template or individually – with your own volume, price and cost assumptions.
Yes. Compare conservative, base and growth cases side by side – year by year and against targets.
As a proof of concept, we’ll rebuild your strategic model in Fincorex® and show it to you at our next meeting.
Book a demo