
Don’t wait for month-end or quarter-end to see your results. Plan and report data as often as your business needs – and react to change in time.
Days, weeks, 10-day periods and custom periods in one model.
Consistent week-on-week and year-on-year comparisons.
E.g. 10-day spending cycles or sales seasons.
Results by product, store or channel every day.
Stock level and days of inventory, always up to date.
E.g. cash flow for the next 6 weeks, updated weekly.
Monthly budget broken down into days and weeks.
Daily data adds up to month, quarter and year.
Variances visible the very next day.
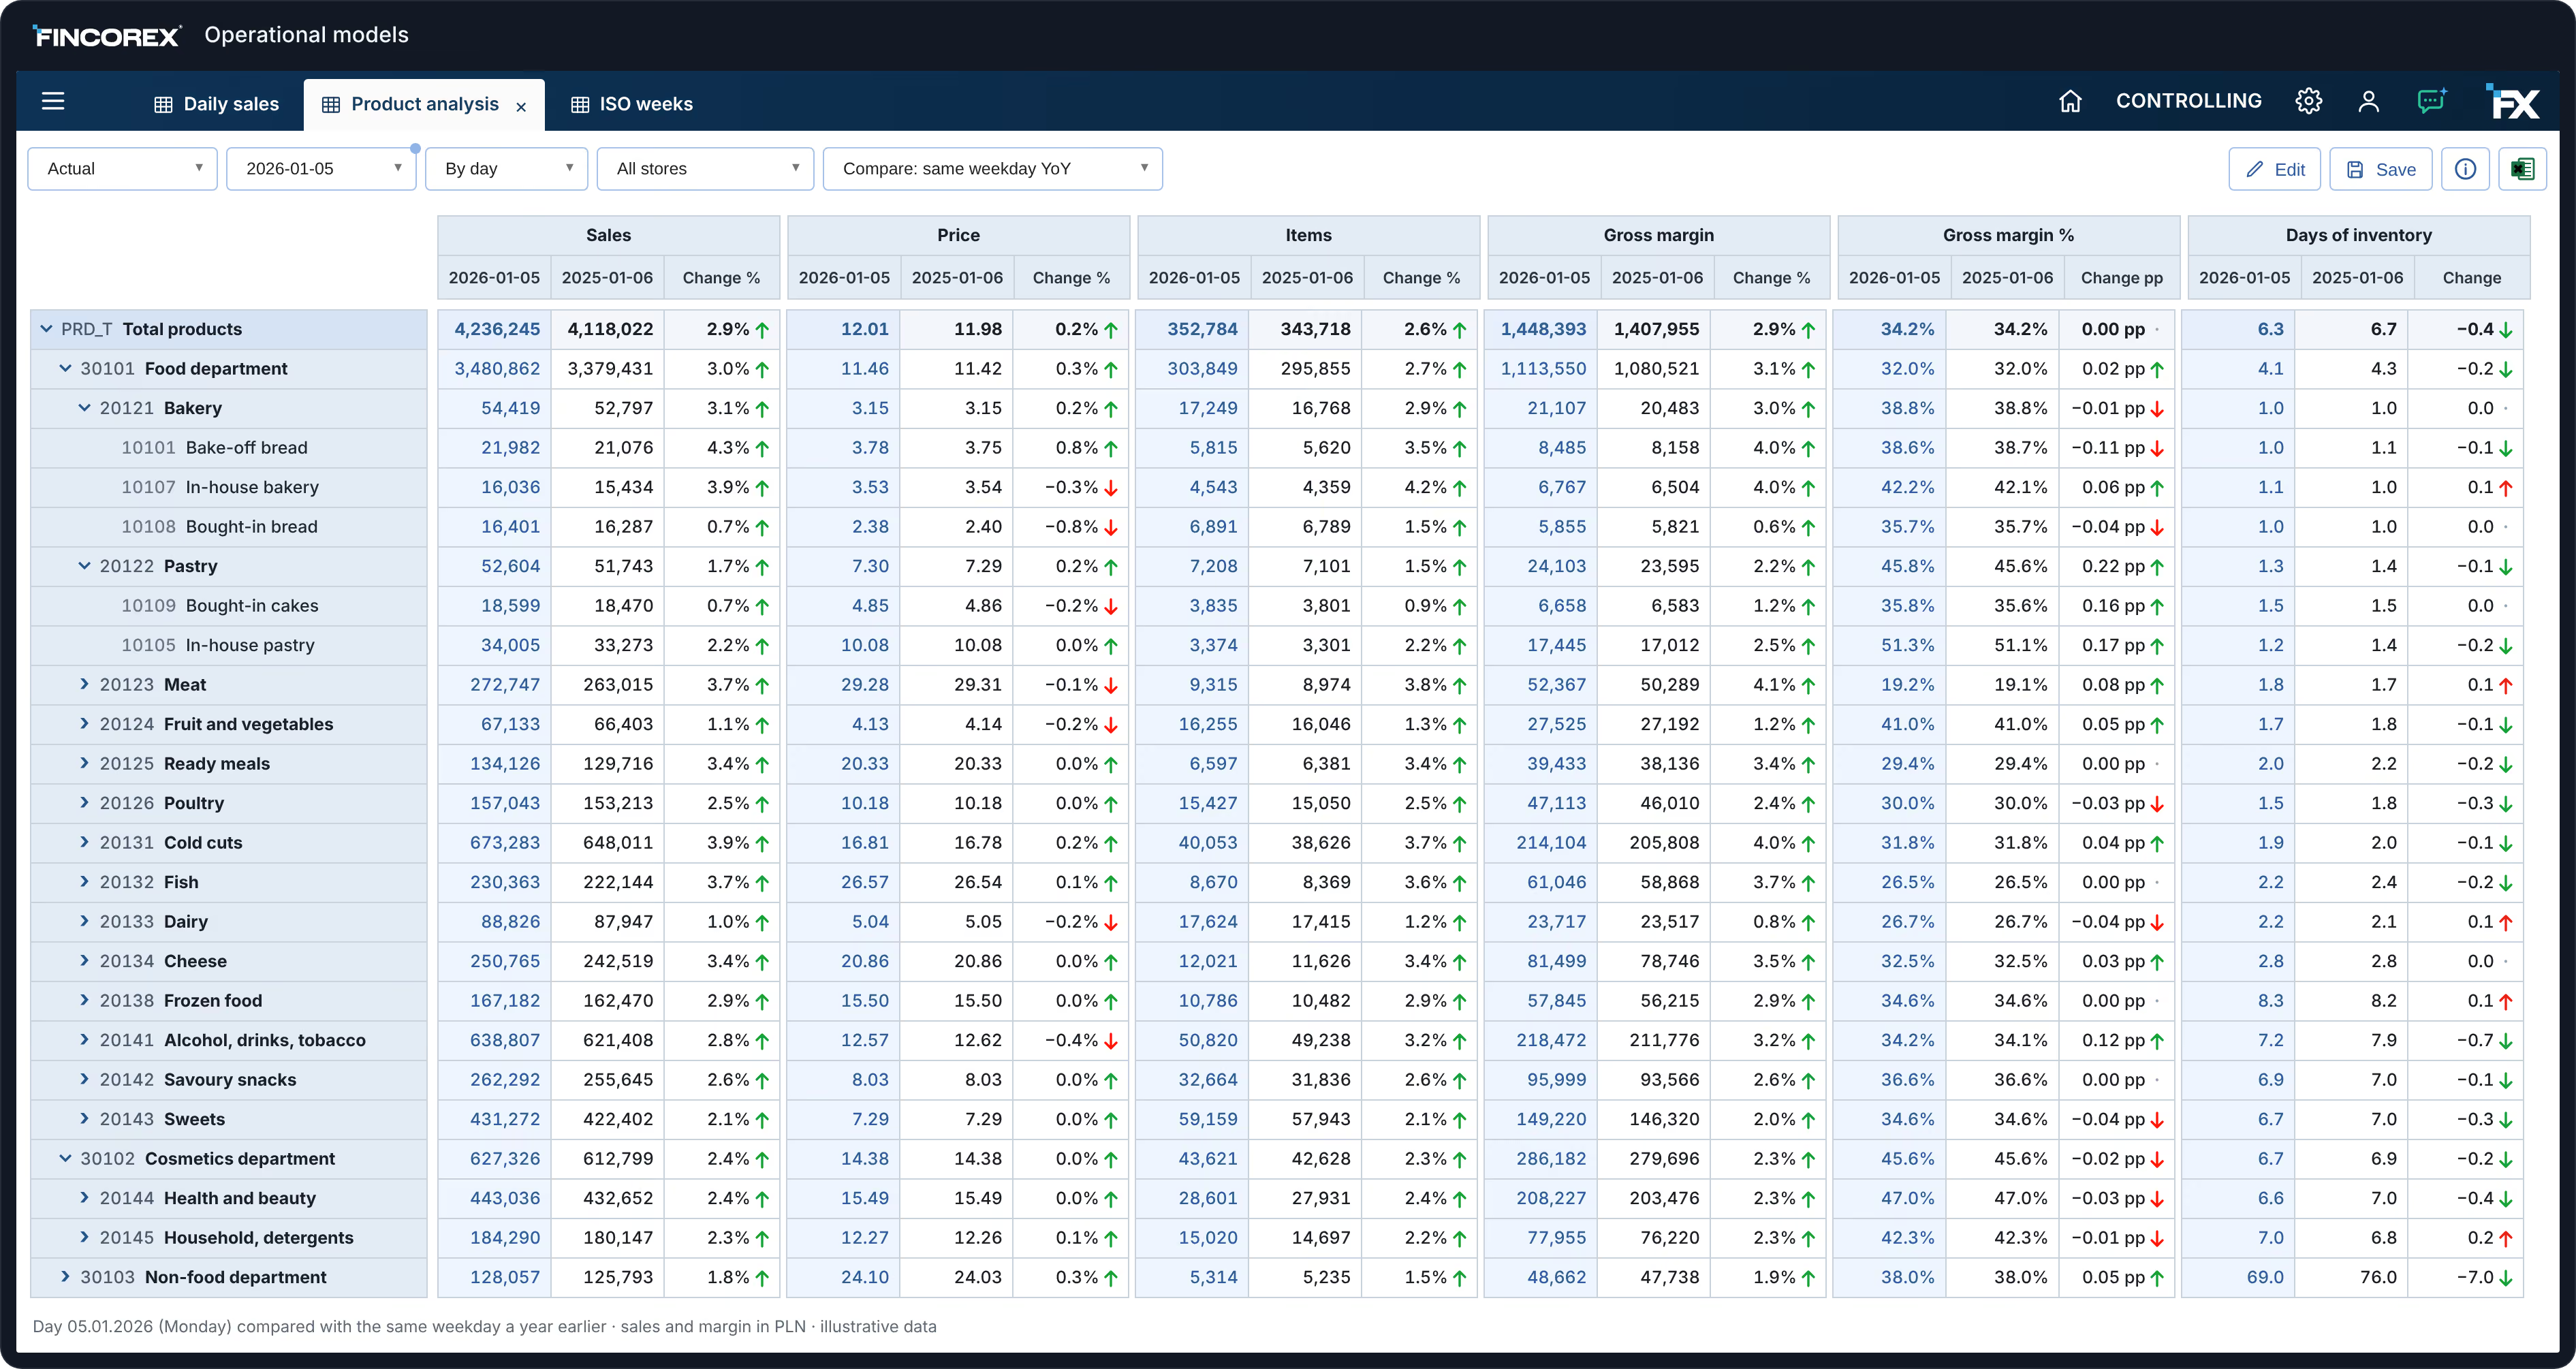
A daily analysis of sales, margin and inventory shows changes immediately – not after month-end close. Comparing with the same weekday a year earlier tells you whether it’s a trend or a one-off spike.
PLN · same weekday comparison · illustrative data
A weekly cash flow forecast 6 weeks ahead, updated every week. In this example the balance drops below the minimum in week 51 – there is time to reschedule payments or arrange financing.
Opening balance PLN 2,400k · ISO 8601 weeks · PLN thousands · illustrative data.
Choose a planning and reporting rhythm that matches how your business runs.
Results by product, store or channel every day. Respond to falling sales and excess stock right away.
Analyse spending in 10-day cycles and keep the budget under control before the month ends.
A weekly cash flow forecast for the next 6 weeks, updated every week.
The same daily data feeds operational and monthly reports. A manager sees their store or product, the board sees the weekly summary.
Data access according to assigned permissions.
Daily and weekly dashboards on model data.
Data from ERP, accounting, sales and inventory systems.
The same data by day, week, month and year.
Sample report layout · illustrative data
Any: daily, ISO weekly, 10-day or periods tailored to your business. Data from shorter periods adds up to months, quarters and the year.
An ISO week always starts on Monday and has a fixed number in the year, so week-on-week and year-on-year comparisons stay consistent.
From the systems you already have – ERP, accounting, sales and inventory systems. We load data as often as you need.
Yes. Break the monthly budget down into days or weeks and compare it with actuals as you go.
Each week, actuals replace the forecast for the past week and the horizon moves one week forward. You always see the cash balance for the next 6 weeks.
As a proof of concept, we’ll rebuild your daily or weekly report in Fincorex® and show it to you at our next meeting.
Book a demo